 Despite my hatred for the Touch Bar, I recently purchased a new 16" Touch Bar-equipped MacBook Pro (and promptly did my best to minimize the Touch Bar's annoyances). Why buy a machine with an interface I dislike? There are a number of reasons…
First and foremost, I've decided it's not really worth the effort to maintain two laptops—my old 2013 MacBook Pro is used for beta versions of macOS, so that I can test Many Tricks' apps, and my 2018 Air is my travel and "around the house" machine.
With the new APFS filesystem, though, creating additional volumes (basically equivalent to a partition in the old world) is really simple, and with ultra-fast solid state drives, rebooting is relatively quick.
So it's my intent to replace both machines with the new MacBook Pro. Yes, it'll be more of a pain when I travel (heavier and bigger), but I don't travel a ton, and even when I do, I do most of my work in hotel rooms, not in airplanes. And I'll appreciate the larger screen and improved performance, in exchange for lugging a bit more weight around.
What follows is a look at my new portable Mac, comparing its performance with both the 2013 MacBook Pro and the 2018 MacBook Air—similar to what I've done for that same MacBook Air and my 2019 iMac (Part One, Part Two, and Addendum).
So why this particular machine, especially given it has a Touch Bar? Well, despite my disdain for the Touch Bar, it's clear it's not going anywhere—and we (Many Tricks) have a couple apps that use it, as well as customers who ask us about its use in our apps. So it makes sense that I have a Mac with a Touch Bar…I guess.
Once I got past the Touch Bar, I really liked the specs on the new 16" machines—the screen size is wonderful, the new-old "scissor" keyboard is notably quieter (and hopefully more reliable) than the "butterfly" keyboard on my Air (keep reading for more on that), and it has a physical Escape key—which is a critical item for me, as I use it all the time (clearly others felt the same way and made their desire for a real Escape key known). TouchID is wonderful on the Air, and it seems even quicker on the new MacBook Pro.
Unlike past purchases, I didn't max out this machine. In fact, I bought the lowest-end spec available—the $2,399 model with the six-core Core i7 CPU, 16GB of RAM, 512GB SSD storage, and the AMD Radeon Pro 5300M with 4GB of RAM (and saved $100 as it was on sale at Costco). Why didn't I upgrade it?
For my needs, it seemed plenty powerful even in base form, and upgrades would quickly have blown the budget. If budget wasn't an issue, then the eight-core 2.4GHz Core i9 with 32GB of RAM and the upgraded video card would've been my choice—but that's another $1200 over what I paid.
With the release of the 2015 MacBook, Apple introduced its new "butterfly" keyboard mechanism. Despite going through (at least) three generations of evolution, there were "some" issues with this design…

As a general rule, if there are over 3.5 million matches for a search on troubles with your keyboard design, and the top hit is a guide to said issues, well, it's probably time to toss that keyboard design. And that's just what Apple did with the new 16" MacBook Pro—out with the "butterfly," in with the "scissors," which is the mechanism Apple had used before the rollout of the butterfly.
My 2018 Air has the butterfly keyboard, and I think the feel is fine–some people complain about the short travel, but it feels fine for my typing style. However, I have had some occasional letter dropouts (the "A" key) which seem to have stopped now (the debris must have moved?). But the other problem I have with it is that it's loud.
When I posted my original review, I said the noise didn't bother me—and it didn't, when I was sitting at home. But out and about with the machine, the loudness of the keyboard became an issue—if I was in a quiet place, I had to alter my typing to be much more gentle than I'm used to as it otherwise felt like everyone was looking around to find the source of the loud typing noise!
Thankfully, the new scissor-based mechanism is much quieter:
As with my test of the 2018 Air, that's me typing the well-known quick-fox-lazy-dog pangram on all three machines—though I added "and then she went to the bar to get a beer" just to increase the typing time (and maybe she did, who knows?). I had my iPhone on a small tripod, positioned just to the side and slighly above each machine.
As you can hear, the new MacBook Pro is notably quieter than the 2018 Air (and the 2013 MacBook Pro, for that matter). I really like the quiet keyboard, and the feel is fine for me.
Here are my three most-recent laptops compared at a high level…
| 2019 16" MacBook Pro | 2013 13" MacBook Pro | 2018 13" MacBook Air | |
|---|---|---|---|
| CPU | Core i7 Six Core "Coffee Lake" | Core i7 Dual Core "Haswell" | Core i5 Dual Core "Amber Lake" |
| CPU Speed | 2.6GHz | 2.8GHz | 1.6GHz |
| Thermal Design Power1Thermal Design Power (TDP) represents the average power, in watts, the processor dissipates when operating at Base Frequency with all cores active under an Intel-defined, high-complexity workload. (Intel's definition) | 45 watts | 28 watts | 7 watts |
| Battery size | 100 watt-hours | 72 watt-hours | 50 watt-hours |
| Battery life2Wireless web • video playback | 11 hrs • 11 hrs | 9 hrs • 9 hrs | 12 hrs • 13 hrs |
| RAM | 16GB | 8GB | 8GB |
| RAM Speed | 2666MHz DDR4 | 1600MHz DDR3 | 2133MHz LPDDR3 |
| Storage | 512GB | 512GB | 256GB |
| Graphics | Intel HD Graphics 4000 and AMD Radeon Pro 5500M/4GB | Intel Iris | Intel UHD Graphics 617 |
| Screen Resolution | 3072x1920 retina | 2560x1600 retina | 2560x1600 retina |
| Dimensions | .64"H x 14.09"W x 9.68"D | .71"H x 12.35"W x 8.62"D | .61"H x 11.97"W x 8.36"D |
| Weight | 4.30 lbs | 3.46 lbs | 2.75 lbs |
What stands out to me in the above table is the Thermal Design Power line—a measure of how much power the CPU dissipates when running an Intel-defined task on all of its cores. The 16" MBP is a power hog, with over six times the usage of the Air, and 60% more than my 2013 MBP.
To counter that, the battery size is double that of the Air, and nearly 40% more than the older MBP. Despite that massive battery, the Air's efficiency still wins the battle for longest battery life.
There's no doubt that the size issue will be one of my challenges in making this switch—the new MacBook Pro is 56% heavier than the MacBook Air, and encloses about 43% more volume. In more basic terms, that means it's about 2.1" (5.3cm) wider, 1.3" (3.3cm) deeper, and just the tiniest bit thicker than the Air. Here's how that looks visually:

If I did a lot of airline travel, I think I'd find the 16" a bit too big for use in cramped coach seating. I probably won't find out how bad it is for a while, as I have no air travel plans in the near future.
OpenSSL benchmark - CPU
OpenSSL "is a robust, commercial-grade, and full-featured toolkit for the Transport Layer Security (TLS) and Secure Sockets Layer (SSL) protocols. It is also a general-purpose cryptography library." At least, that's what it says on their web site. (Note that macOS actually uses LibreSSL, which was forked from OpenSSL in 2014. For ease of reference, I'll continue to refer to it as OpenSSL.)
For my purposes, I like that OpenSSL is built into every version of macOS, and that it includes a nifty little benchmarking tool: In Terminal, just type openssl speed and then wait a while. (You can also test using multiple cores with openssl speed -multi nn, where nn is the number of tests to run in parallel.)
The test uses a number of cryptographic hash algorithms with various block lengths to test the speed of those algorithms.
Trying to figure out what caused the improvement sent me down a rabbit hole from which I didn't escape with a complete answer. Read the linked article for the gory details, but it appears Apple implemented something called AES-NI in 10.14.5, and that's what caused the speedup.
The net result, though, is that you can't compare the following results to my those in the prior articles. Since they weren't comparable anyway, I changed things up a bit and focused on the results when running tests in parallel (on multiple cores).
Here are the results for my three laptop Macs…note that there are many more tests run; this is just a sampling of the output. (The higher the rate, the better the result.)
| Multi-core tests | 2019 16" MBP 12 cores | 2013 13" MBP 4 cores | 2018 13" MBA 4 cores | ||
|---|---|---|---|---|---|
| Result | Result | 16" MBP is: | Result | 16" MBP is: | |
| DSA 1024 sign/sec | 51,263.9 | 12,728.7 | +302% | 11,310.9 | +353% |
| DSA 1024 verify/sec | 56,745.1 | 13,794.7 | +311% | 12,328.8 | +360% |
| DSA 2048 sign/sec | 19,501.7 | 4,908.0 | +297% | 4,221.9 | +362% |
| DSA 2048 verify/sec | 18,919.7 | 5,001.8 | +278% | 4,085.2 | +363% |
| RSA 2048 sign/sec | 6,714.9 | 1,611.6 | +317% | 1,537.4 | +337% |
| RSA 2048 verify/sec | 126,315.8 | 29,797.1 | +324% | 28,522.2 | +342% |
| RSA 4096 sign/sec | 915.4 | 175.2 | +422% | 203.5 | +350% |
| RSA 4096 verify/sec | 34,549.0 | 7,383.5 | +368% | 7,623.7 | +353% |
| Single Core Tests | |||||
| RSA 4096 sign/sec | 169.8 | 101.4 | +67% | 126.6 | +34% |
| RSA 4096 verify/sec | 6,199.6 | 3,729.2 | +66% | 4,616.8 | +34% |
As expected, having 12 cores available on the 16" MBP led to it easily outpacing the other two machines. In the single-core tests, the new machine still won, though not by nearly the same wide margins. It's interesting to note that the four cores in the Core i7 in the 2013 MBP performed slightly better than the four cores in the Core i5 in the 2018 Air: The Air won the single-core tests against the 2013 MBP, but was generally slower on the multi-core tests.
Geekbench 4 - CPU and GPU
Geekbench 4 is a cross-platform benchmark suite that tests both the CPU and the GPU (the "Compute" tests). There are a total of four tests—CPU single and multiple core, and GPU tests using OpenCL and Metal. Here's how my three Macs scored (higher is better)…
| Geekbench 4 | 2019 16" MBP | 2013 13" MBP | 2018 13" MBA | ||
|---|---|---|---|---|---|
| Result | Result | 16" MBP is: | Result | 16" MBP is: | |
| CPU Single Core | 5,394 | 3,807 | +42% | 4,313 | +25% |
| CPU Multi Core | 24,226 | 7,009 | +246% | 7,876 | +208% |
| Compute OpenCL | 84,030 | 20,120 | +318% | 21,087 | +298% |
| Compute Metal | 71,004 | 17,837 | +298% | 22,026 | +222% |
The new 16" MBP has both on-board video (Intel HD Graphics 4000) and a separate video card (AMD Radeon Pro 5500M/4GB). I tested with the video card, and it makes a tremendous difference on the Compute results. As a quick comparison, the Compute OpenCL score was 31,771 on the onboard video, and Compute Metal was 24,453—both those figures are well behind the scores when using the separate video card.
Cinebench - CPU and GPU
Cinebench is a benchmark that tests both the GPU (using an OpenGL animated car chase) and the CPU (by rendering a photorealistic 3D image). I've used version 15 for years, but version 20 is current and is supposed to work better with modern CPUs. However, only version 15 splits out the OpenGL performance, so that's why I keep using it.
| Cinebench | 2019 16" MBP | 2013 13" MBP | 2018 13" MBA | ||
|---|---|---|---|---|---|
| Result | Result | 16" MBP is: | Result | 16" MBP is: | |
| R15 OpenGL | 115.8 | 24.7 | +369% | 34.8 | +233% |
| R15 CPU | 1,150 | 272 | +322% | 257 | +347% |
| R20 CPU | 2,790 | 690 | +304% | 573 | +387% |
As with the Geekbench results, the new 16" MBP simply outclasses the other two. You can see the impact of the slower CPU in the Air's results—it lost both the CPU tests to the six-year-old 2013 MBP.
Air: Slower CPU hurt it a lot, it's behind the 2013 MBP in the two CPU tests.
Blackmagic Disk Speed Test - Disk
The Blackmagic Disk Speed Test is a handy tool for measuring the read and write speed of your disks. This is one area where I expected my new machine to easily best both of its older stablemates, and I was right…
| Blackmagic Disk Speed | 2019 16" MBP | 2013 13" MBP | 2018 13" MBA | ||
|---|---|---|---|---|---|
| Result | Result | 16" MBP is: | Result | 16" MBP is: | |
| Read | 2,608.4 | 607.4 | +329% | 2,048.2 | +27% |
| Write | 2,740.1 | 656.8 | +317% | 913.7 | +200% |
Pretty soon, I think we're going to have to start measuring disk speed as a percentage of the speed of light. It's ridiculous how fast these solid state drives have gotten.
Heaven - GPU
Heaven is a 2009 OpenGL benchmark test that still runs fine on today's hardware. The benchmark runs through a number of animated 3D scenes, and at the end, returns an average frames per second and a score, based on the average FPS as well as the high and low FPS.
I ran these tests in a 1280x800 window (to match the Air's resolution), with anti-aliasing at 2x, and all other settings at their default values.
| Heaven | 2019 16" MBP | 2013 13" MBP | 2018 13" MBA | ||
|---|---|---|---|---|---|
| Result | Result | 16" MBP is: | Result | 16" MBP is: | |
| FPS range | 16.7 - 232.1 | 7.0 - 27.2 | -- | 14.3 - 33.4 | -- |
| Average FPS | 131.8 | 16.1 | +718% | 18.8 | +601% |
| Score | 3,321 | 362 | +817% | 673 | +393% |
If you had any doubts that a separate video card would be better than onboard video, the above results should dispel those doubts. The new machine just crushed the other two.
Valley - GPU
Valley is the 2013 follow-on to 2009's Heaven. Again, I used the "basic" test running in a window at 1280x800, with anti-aliasing at 2x, and all other settings at their default values.
| Valley | 2019 16" MBP | 2013 13" MBP | 2018 13" MBA | ||
|---|---|---|---|---|---|
| Result | Result | 16" MBP is: | Result | 16" MBP is: | |
| FPS Range | 35.1 - 157.3 | 7.8 - 18.1 | -- | 10.5 - 24.0 | -- |
| Average FPS | 105.8 | 11.3 | +836% | 16.1 | +557% |
| Score | 4,429 | 473 | +836% | 637 | +595% |
Have I mentioned how nice it is to have a discrete video card for pushing lots of pixels in a hurry?
GFXBench Metal
GFXBench Metal is an App Store app that tests GPU performance using Metal, Apple's new hardware-accelerated graphics technology. As such, I thought it would be a good benchmark to use, given Apple's move away from OpenGL. Unfortunately, it's quite flakey, as it quits on launch on certain machines and works fine on others. (It's not just me; the reviews are filled with such comments.)
Thankfully, it runs fine on all three of these laptops. Many of the tests have both offscreen and onscreen variants. The onscreen variant runs at the device's native resolution, happening live on screen. The offscreen version runs at 1440p, but does so totally offscreen—it's stated that the offscreen version is the best to use when comparing different machines, so here are those results first:
| Offscreen tests (frames/sec) | 2019 16" MBP | 2013 13" MBP | 2018 13" MBA | ||
|---|---|---|---|---|---|
| Result | Result | 16" MBP is: | Result | 16" MBP is: | |
| Car Chase | 189.3 | 20.2 | +837% | 21.3 | +789% |
| 1440p Manhattan 3.1.1 | 182.1 | 15.4 | +1,082% | 33.1 | +450% |
| 1080p T-Rex | 745.8 | 79.3 | +840% | 96.1 | +676% |
| 1080p Driver Overhead 2 | 199.9 | 72.7 | +175% | 91.5 | +118% |
| 1080p Texturing | 55.4 | 26.1 | +112% | 25.8 | +115% |
I then ran the onscreen tests, but it seems they're capped at 60 frames per second—three of the five tests on the new MacBook Pro are very close to that rate. I'm including the results, but honestly, I think the new machine would've performed better on those three tests if there weren't a framerate cap.
| Onscreen tests (frames/sec) | 2019 16" MBP | 2013 13" MBP | 2018 13" MBA | ||
|---|---|---|---|---|---|
| Result | Result | 16" MBP is: | Result | 16" MBP is: | |
| Car Chase | 47.9 | 10.7 | +347% | 8.8 | +444% |
| Manhattan 3.1 | 59.0 | 14.1 | +318% | 13.0 | +353% |
| T-Rex | 60.0 | 51.4 | +17% | 50.1 | +20% |
| Driver Overhead 2 | 60.4 | 57.2 | +5% | 58.4 | +3% |
| Texturing | 32.7 | 25.9 | +26% | 25.9 | +26% |
Note: This is the same battery test I ran in the prior writeup of my 2018 MacBook Air. Skip the text if you've seen it before.
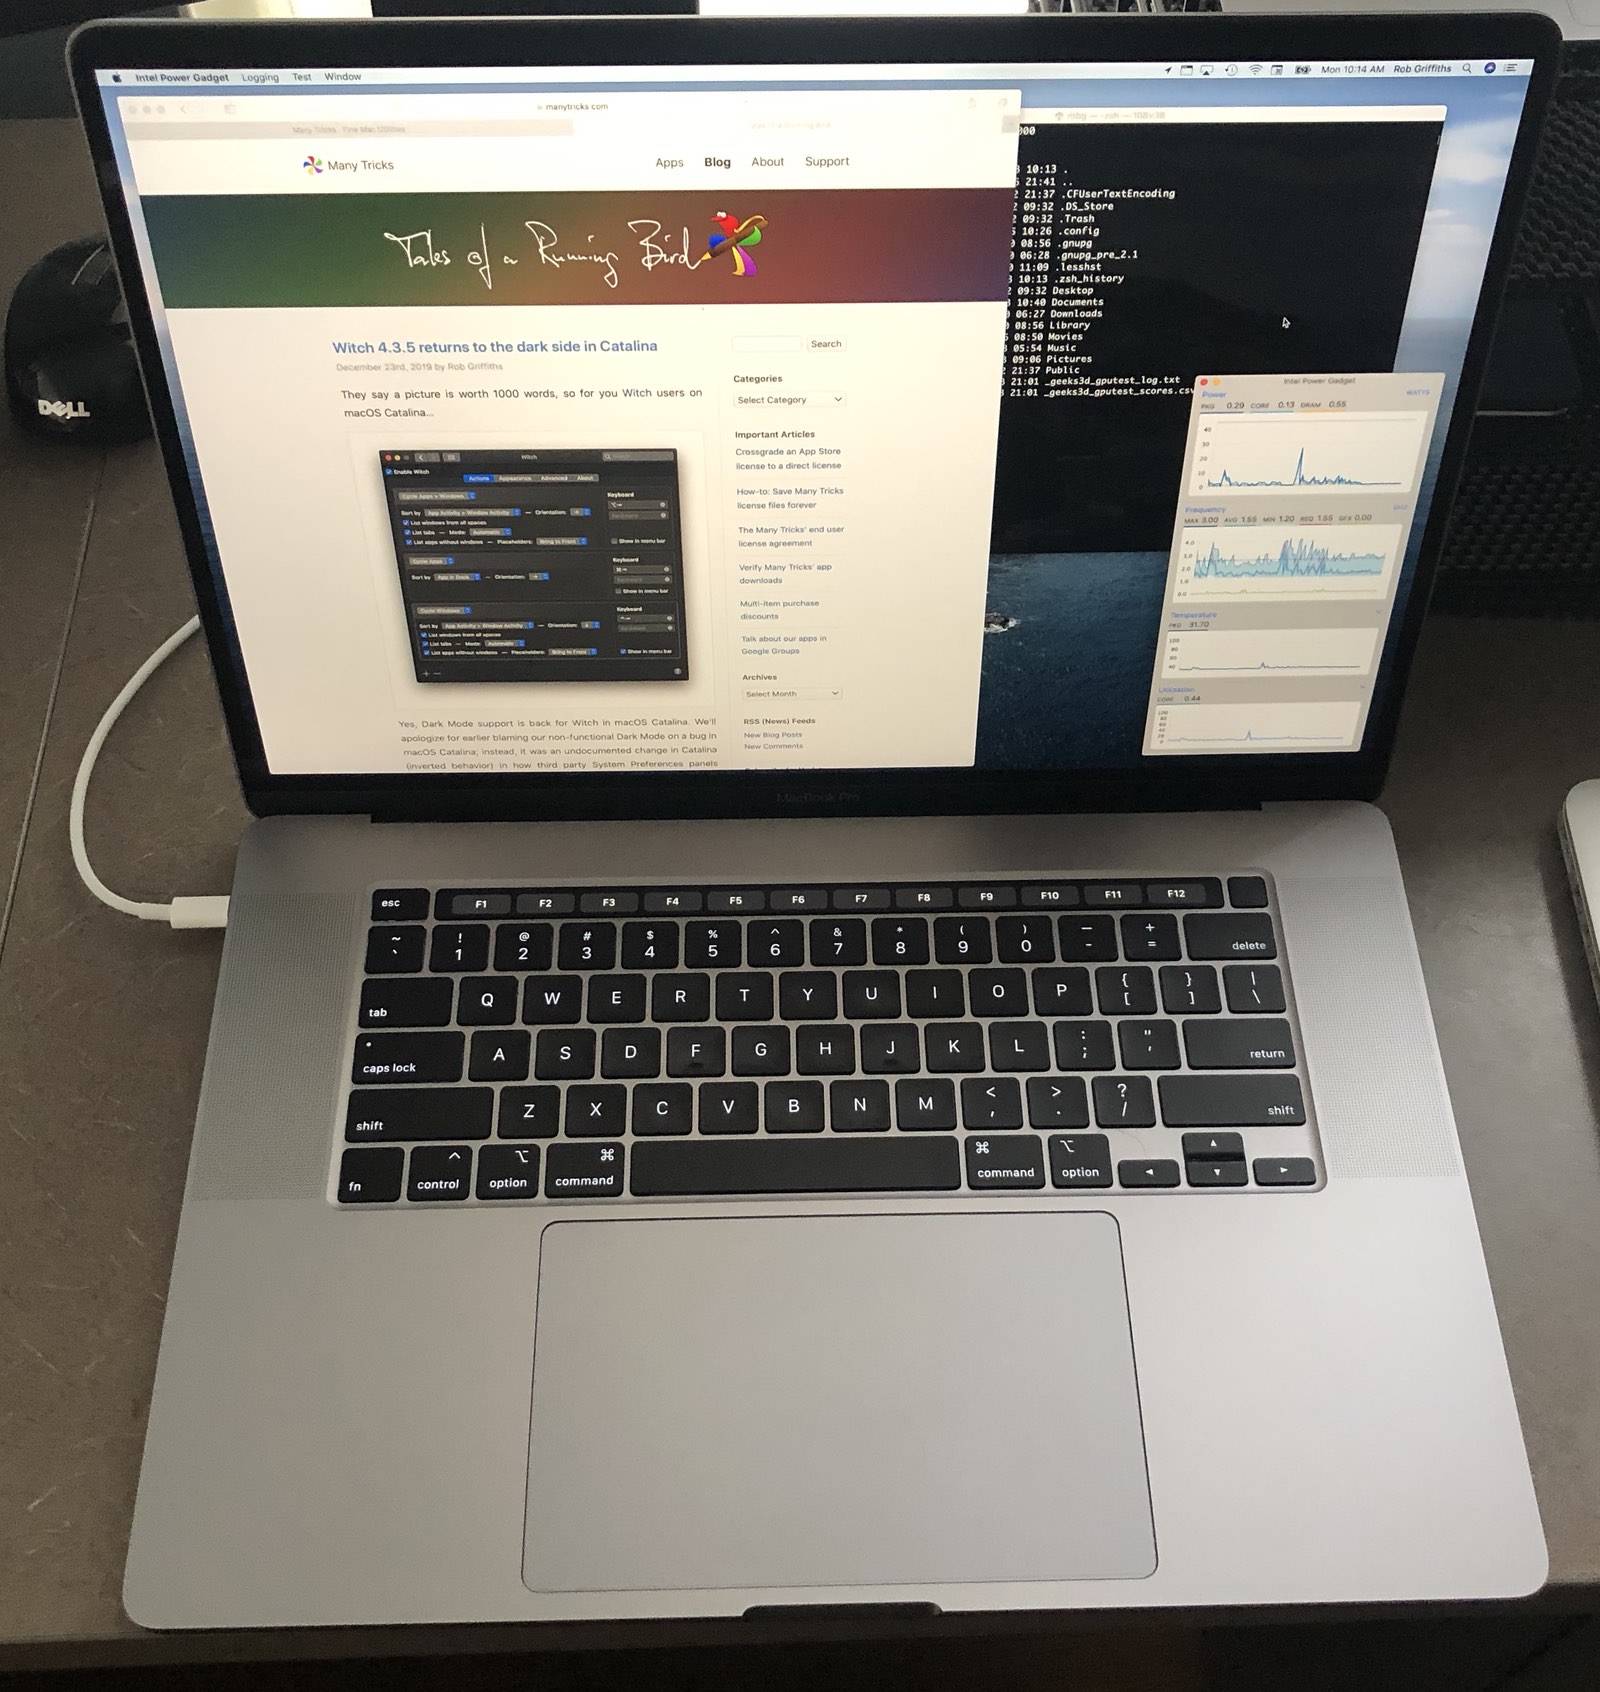
For my test, I played the first (and still best) Jurassic Park movie from the hard drive while running htop, an enhanced version of top, just to give the machine a bit more to do. I also had the Intel Power Gadget app open and charting during the hour. Each machine's screen looked roughly like this:

I charged the machines so they had full batteries, set the brightness to about 50%, unplugged the power cords, and started the movie. After one hour, I quit the open apps and took some measurements in Terminal, using pmset -g batt. This command will return the current battery charge level (in percentage), as well as an estimate as to remaining life. Here's the output from each machine after the hour (note that this also includes my prior-gen Air, a 2012 model):
2012 Air: 78%; discharging; 2:30 remaining
2013 MBP: 90%; discharging; 6:10 remaining
2018 Air: 97%; discharging; 10:52 remaining
2019 MBP: 93%; discharging; 10:24 remaining
The battery champ, in my weird one-hour simplistic test, is the Air, with about 30 minutes more time than the new MacBook Pro. (The 2013 MacBook Pro's battery is a bit aged, so that affects its longevity.) In my current job, I rarely run into battery life issues (unless I take the machine camping), so I'm sure I'll be fine with "only" 10.5 hours.
I've now had the machine for a couple of weeks, and love the performance—the discrete graphics card means I could actually play some games on the thing if I wish, and even this lowest-end of the new machines easily bests my other two laptops. In day-to-day use, it feels more than fast enough for anything I'm likely to do with it.
I really like the revised keyboard—it's quieter and still feels fine for typing, and will (hopefully) be more reliable than the butterfly keyboards. The screen is very nice too, and quite readable even at the "More Space" setting of 2048x1280.
My main dislike going in—the Touch Bar—is a non-issue after I basically rendered it useless by forcing the Fn keys to show all the time.
I'm sure I'm going to dislike the size and weight when traveling with it, but it'll be a while before I find out just how much of a hassle that is. And since the only way to go on this is all in, my 2013 MBP and 2018 Air will shortly be for sale—if they're not here, I won't be tempted to use them!
You have a seriously powerful 2012 MacBook Pro LOL (there’s a typo on a chart)
Mike:
OK, which chart? I looked at them all, and I don’t see any figures that are out of line. Which one’s wrong?
-rob.
Nice article and summary of comparisons between MacBooks spanning across almost a decade... I just bought a new 2018 MBPro 15" in July 2019 - now, I wish I would have believed the rumors and waited for the 16inch :)
P.S. Typo is in the column header of the 1st chart - it says 2012 16" instead of 2019 16".
Ah, thanks! Reading Mike's comment, I was looking for a data error, not a heading error. All better now!
-rob.
The 2018 is faster on the Geekbench score, you have great machine.
Comments are closed.