 If you're the type who likes to keep an eye on your system, you may be familiar with tools such as Activity Montior's CPU meters, or iStat Menus, which displays a ton of system info via its menubar icon. Neither of these tools, however, really show you what the CPU itself is up to—and that's where an Intel-provided tool enters the scene.
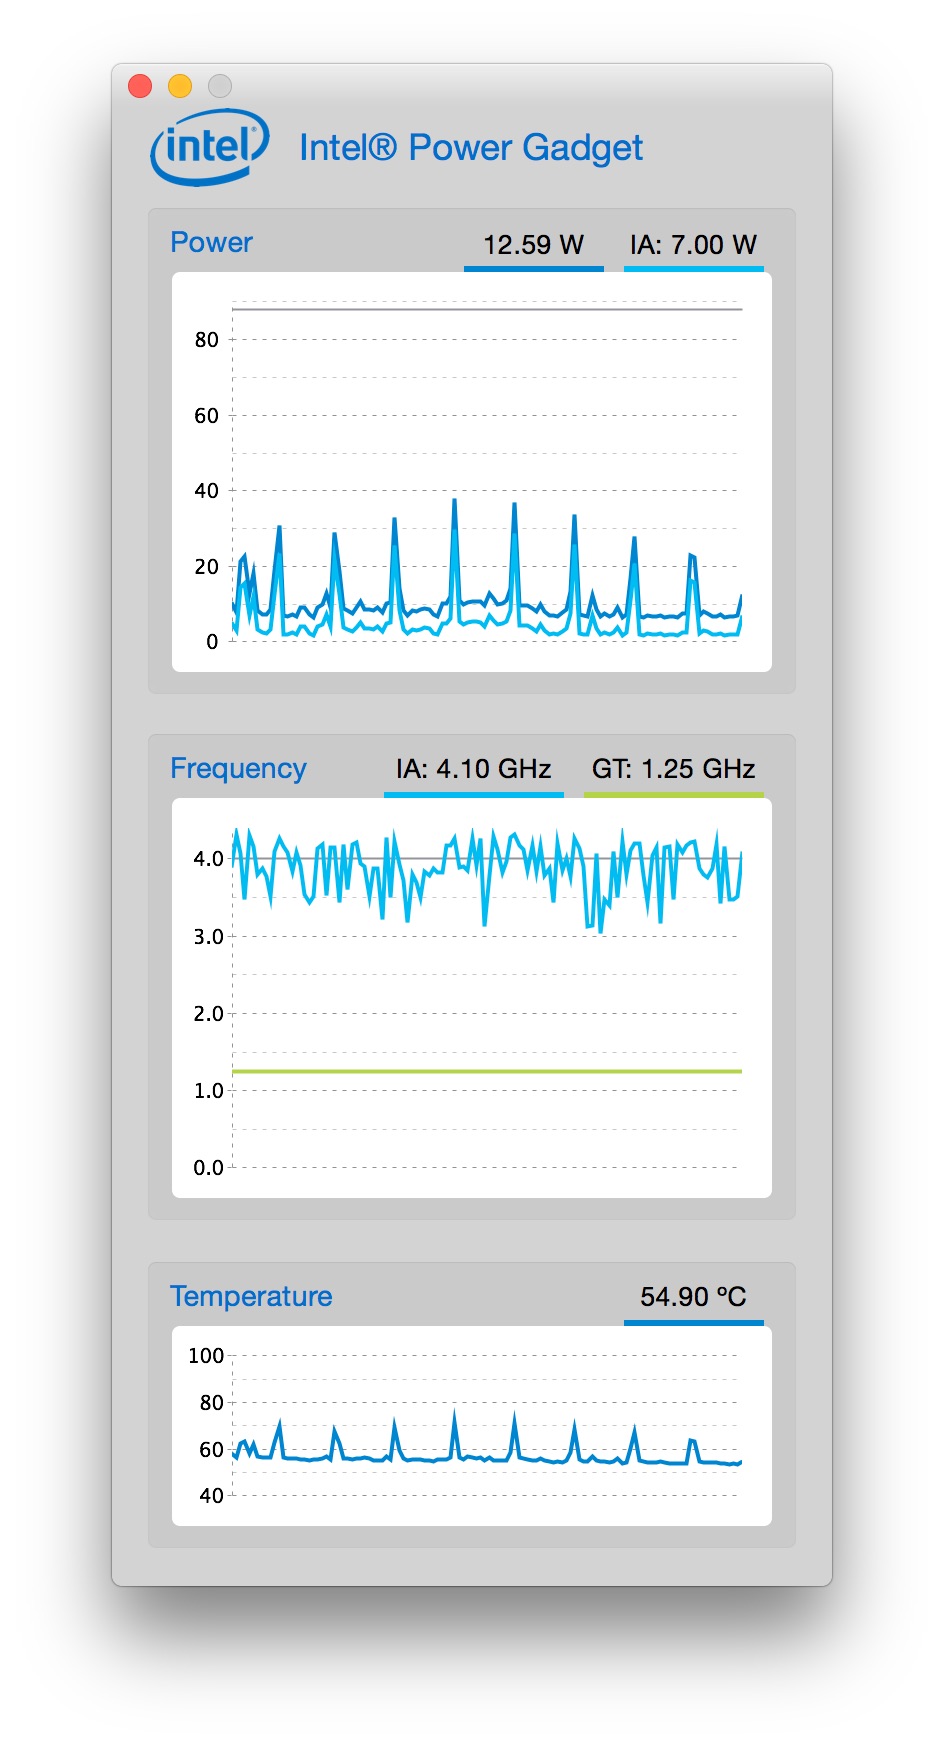
The Intel® Power Gadget shows you exactly what your CPU is up to: how much power it's using, what speed it's running at, and its temperature. As seen in the image at right (click for larger), it graphs these three values over time.
The data you're seeing there is from my 4GHz Retina iMac, and the screenshot was grabbed while it wasn't doing much in particular. What really stands out to me is how often my 4GHz CPU is running at something closer to 3GHz; if the CPU isn't being called on for its full power, I'm assuming it slows itself down to reduce power usage.
But as soon as you do something that demands the CPU's full power, the napping stops. Here's a brief movie I created showing the CPU tracking when I started ripping a Blu-Ray:
The machine is basically idle at first, then I start the rip after 15 seconds or so. As soon as the hard work starts, the power and temperature charts shoot upwards, and over time, the CPU speed pegs right around 4GHz; the naps are gone.
I'm not sure how much real-world use this tool has, but from a geeky perspective, it's pretty cool being able to see exactly what your CPU is up to at any point in time. (You can even send the data to a log file, in case you really want to study power, speed, and temperature over an extended time period.)
Hi! I have a Retina iMac too and since 10.10.3 the UI lag definitely improved. Don't about your experience though...
Comments are closed.